API Reference
displayio_cartesian
A cartesian plane widget for displaying graphical information.
Author(s): Jose David M.
Implementation Notes
Hardware:
Software and Dependencies:
Adafruit CircuitPython firmware for the supported boards: https://github.com/adafruit/circuitpython/releases
- class displayio_cartesian.Cartesian(background_color: int = 0x000000, xrange: ~typing.Tuple[int, int] = (0, 100), yrange: ~typing.Tuple[int, int] = (0, 100), axes_color: int = 0xFFFFFF, axes_stroke: int = 1, tick_color: int = 0xFFFFFF, major_tick_stroke: int = 1, major_tick_length: int = 5, tick_label_font: <fontio.BuiltinFont object at 0x7cd3e25eb230> = terminalio.FONT, font_color: int = 0xFFFFFF, pointer_radius: int = 1, pointer_color: int = 0xFFFFFF, subticks: bool = False, nudge_x: int = 0, nudge_y: int = 0, verbose: bool = False, **kwargs: ~typing.Any)
A cartesian widget. The origin is set using
xandy.- Parameters:
x (int) – x position of the plane origin
y (int) – y position of the plane origin
background_color (int) – background color to use defaults to black (0x000000)
width (int) – requested width, in pixels.
height (int) – requested height, in pixels.
axes_color (int) – axes lines color defaults to white (0xFFFFFF)
axes_stroke (int) – axes lines thickness in pixels defaults to 2
major_tick_stroke (int) – tick lines thickness in pixels defaults to 1
major_tick_length (int) – tick lines length in pixels defaults to 5
tick_label_font (terminalio.FONT) – tick label text font
font_color (int) – font color. Defaults to white (0xFFFFFF)
pointer_radius (int) – pointer radius in pixels defaults to 1
pointer_color (int) – pointer color. Defaults to white (0xFFFFFF)
subticks (bool) – inclusion of subticks in the plot area. Default to False
nudge_x (int) – movement in pixels in the x direction to move the origin. Defaults to 0
nudge_y (int) – movement in pixels in the y direction to move the origin. Defaults to 0
verbose (bool) – print debugging information in some internal functions. Default to False
Quickstart: Importing and using Cartesian
Here is one way of importing the
Cartesianclass so you can use it as the namePlane:from displayio_cartesian import Cartesian as Plane
Now you can create a plane at pixel position x=20, y=30 using:
my_plane=Plane(x=20, y=30) # instance the plane at x=20, y=30
Once you setup your display, you can now add
my_planeto your display using:display.root_group = my_plane # add the group to the display
If you want to have multiple display elements, you can create a group and then append the plane and the other elements to the group. Then, you can add the full group to the display as in this example:
my_plane= Plane(20, 30) # instance the plane at x=20, y=30
my_group = displayio.Group() # make a group
my_group.append(my_plane) # Add my_plane to the group

#
# Append other display elements to the group
#

display.root_group = my_group # add the group to the display
Summary: Cartesian Features and input variables
The
Cartesianwidget has some options for controlling its position, visible appearance, and scale through a collection of input variables:position:
x,y,anchor_point,anchored_positionandnudge_x,nudge_y. Nudge parameters are used to account for the float and int conversions required to display different ranges and values. Conversion are required as displays work in integers and not floatssize:
widthandheightcolor:
axes_color,font_color,tick_color,pointer_colorbackground color:
background_colorlinewidths:
axes_strokeandmajor_tick_strokerange:
xrangeandyrangeThis is the range in absolute units. For example, when using (20-90), the X axis will start at 20 finishing at 90. However, the height of the graph is given by the height parameter. The scale is handled internal to provide a 1:1 experience when you update the graph.
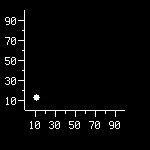
This is a diagram of a cartesian widget with the pointer moving in the plot area.
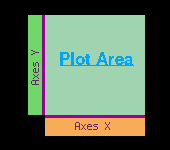
This is a diagram of a cartesian widget showing the different zones.
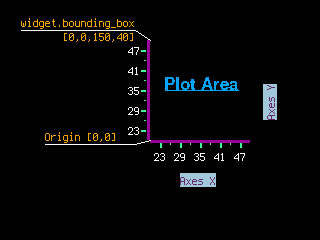
This is a diagram of a cartesian widget showing localisation scheme.
- Parameters:
- update_pointer(x: int, y: int) None
updater_pointer function helper function to update pointer in the plane :param int x:
xcoordinate in the local plane :param int y:ycoordinate in the local plane :return: None rtype: None
- add_plot_line(x: int, y: int) None
add_plot_line function.
add line to the plane. multiple calls create a line-plot graph.
- Parameters:
- Returns:
None
rtype: None
- property anchor_point: Tuple[float, float] | None
The anchor point for positioning the widget, works in concert with
anchored_positionThe relative (X,Y) position of the widget where the anchored_position is placed. For example (0.0, 0.0) is the Widget’s upper left corner, (0.5, 0.5) is the Widget’s center point, and (1.0, 1.0) is the Widget’s lower right corner.
- property anchored_position: Tuple[int, int] | None
The anchored position (in pixels) for positioning the widget, works in concert with
anchor_point. Theanchored_positionis the x,y pixel position for the placement of the Widget’sanchor_point.
- append(layer: Group | TileGrid | vectorio._rectangle._VectorShape) None
Append a layer to the group. It will be drawn above other layers.
- property bounding_box: Tuple[int, ...]
The boundary of the widget. [x, y, width, height] in Widget’s local coordinates (in pixels). (getter only)
- Returns:
Tuple[int, int, int, int]
True when the Group and all of it’s layers are not visible. When False, the Group’s layers are visible if they haven’t been hidden.
- index(layer: Group | TileGrid | vectorio._rectangle._VectorShape) int
Returns the index of the first copy of layer. Raises ValueError if not found.
- insert(index: int, layer: Group | TileGrid | vectorio._rectangle._VectorShape) None
Insert a layer into the group.
- pop(index: int = -1) Group | TileGrid | vectorio._rectangle._VectorShape
Remove the ith item and return it.
- remove(layer: Group | TileGrid | vectorio._rectangle._VectorShape) None
Remove the first copy of layer. Raises ValueError if it is not present.
- resize(new_width: int, new_height: int) None
Resizes the widget dimensions (for use with automated layout functions).
IMPORTANT: The
resizefunction should be overridden by the subclass definition.The width and height are provided together so the subclass
resizefunction can apply any constraints that require consideration of both width and height (such as maintaining a Widget’s preferred aspect ratio). The Widget should be resized to the maximum size that can fit within the dimensions defined by the requested new_width and new_height. After resizing, the Widget’sbounding_boxshould also be updated.